
Calculate Full Time Equivalents (FTEs)
- Introduction
- Prerequisites
- Overview of methods
- Step 1: Create and configure data models
- Application of the "Cartesian product" method
- Application of the "data model "HR_Complete" alone" method
- Congratulations!
Introduction
In this tutorial, we will look at how to calculate the number of FTEs in Digdash.
The FTE or Full Time Equivalent is a unit of measurement that represents the work of a full-time employee. It can be used as a basis for other calculations such as the average number of employees.
To do this, we will use several fictitious data sets:
- The Excel file "Employee_Register" containing information on employees such as their ID, surname, first name, age, etc.
- The CSV file "HR_Contracts" containing employee identifiers, their leaving date and the number of days worked; the latter data is considered on a weekly basis.
- The CSV file "Calendar_2020_2025" containing calendar data, consisting of a single column with dates from 01/01/2020 to 31/12/2025.
Prerequisites
To complete this tutorial, you will need to :
- have installed DigDash Enterprise version 2025R1 or later;
- be a member of the "Data Model Designer" authorization group;
- download the files "Employee_Register", "HR_Contracts.csv" and "Calendar_2020_2025.csv" in the zip file .
ℹ The screenshots in this tutorial were produced using the Chrome browser. There may be slight differences depending on the browser.
Overview of methods
There are two ways of dealing with this subject, each with its own advantages and disadvantages:
- The first consists of creating a Cartesian product between our two datasets. The advantage of this is that we can keep all the data and therefore retain interactivity with the dimensions (for example, filtering on a date). The disadvantage is the volume of data. Here we have: number of rows of HR data (305) x number of calendar rows (2191), i.e. 668,255 records.
- The second solution is based solely on HR data and allows predefined data to be displayed (for example: FTEs over a year, a month or a predefined period). The advantage is a limited volume of data, but on the other hand, the interactivity of the dashboard will be more limited. It will not be possible to filter by date.
Step 1: Create and configure data models
Before you can work with the methods described above, you need to integrate the data into Digdash.
Model Employee_Register
Import the data "Employee_Register" data
Here we are going to import the data from the Excel file "Employee_Register" which represents the human resources data of a fictitious company.
To do this:
- Launch the Studio.
- Open the Models tab.
- Click the New model button.
- In the Create a new data model box, select All types in the Files section.
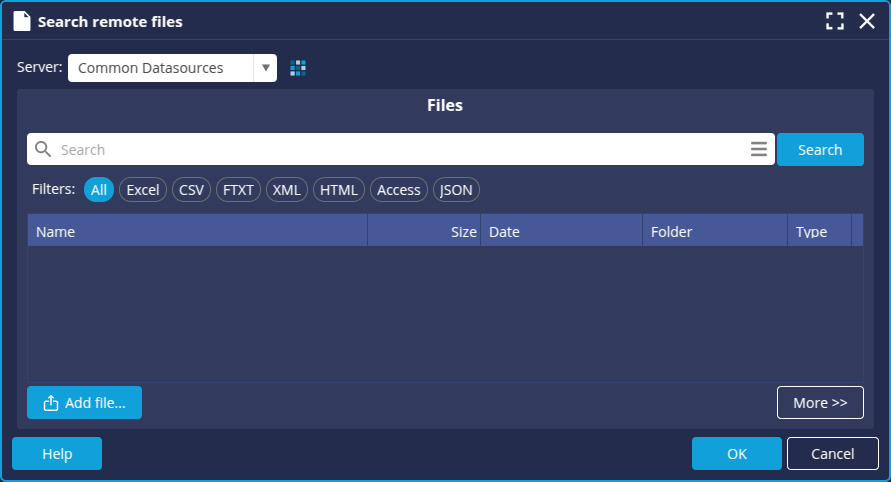
➡ The Search remote files box appears. - In the Server drop-down list, select "Common Datasources."
- Click the Add file... button.
- The Select a local file or URL box appears, keep the default selection From your computer.
- Click Browse to select the "Employee_Register" file retrieved earlier.
- Click OK.
➡ The file is now saved on the "Common Datasources" server and accessible to all users.
- In the Search remote files box, select "Employee_Register".
- Click OK.
The Excel File window appears. It offers data selection options and a preview of the data.
The items in the first row of the table correspond to the data types in each column. We will therefore use them as column headings. For example, Employee ID for column 1. To do this:
- In the Data selection section, select the First row as header checkbox.

We can now move on to configuring the data model: click the Next button at the bottom right to open the data model configuration window.
Configure the data model
The data model configuration window opens on the Columns tab.
The type detected for some columns is not correct.
The Age column was detected as a measure. However, it will be used here as a dimension. To change this:
- Select the Age column.
- In the Type field at the top right, select Dimension.
- Also change the type of the Postcode column: select Dimension (geographical).
You can then save:
- Click Finish and enter a name for the model: Employee_Register.
Model HR_Contracts
Import data "HR_Contracts"
Here we are going to import the data from the csv file "HR_Contracts" containing the employee's identifier, their end date and the number of days worked.
To do this:
- Create a new model in the same way as before and add the HR_Contracts.csv file to the document server.
➡ The Excel File box appears with the data preview. - In the Data selection section, select the First row as header box .
Calculate the FTE
We are now going to calculate the Full Time Equivalent (FTE) for each employee from the number of days worked per week using a data transformation. To do this:
- Add an empty column.
- Click the column header and then, on the context menu, Data Transform...

➡ The Data Transform tab opens and displays the interface to create a transformation with the target column selected. - In the script editor, enter the following code:
return values[2]/5;
return 0;
Here, values[2] corresponds to the "Nb days worked" column.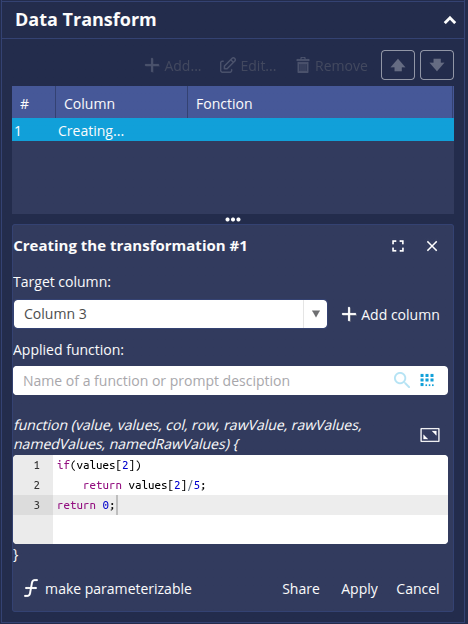
- Click Apply.
➡ You can view the result obtained in the column preview. - Click the
 button to finish.
 - Click the header of Column 3 to rename it: enter Nb FTE.
➡ The result is as follows: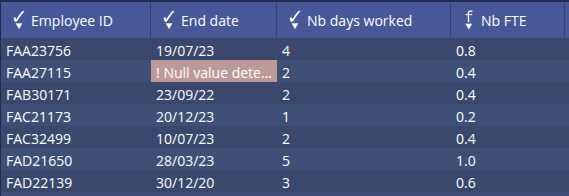
You can now save:
- Click Finish and enter a name for the model: HR_Contracts.
Data model HR_Complete
We are now going to combine the data from the data models "Employee_Register" and "HR_Contracts" by performing a join.
The join consists of aggregating the columns from several models thanks a column match called the join key.
You can consult the page Performing a data join page for more details.
- Click the New model button.
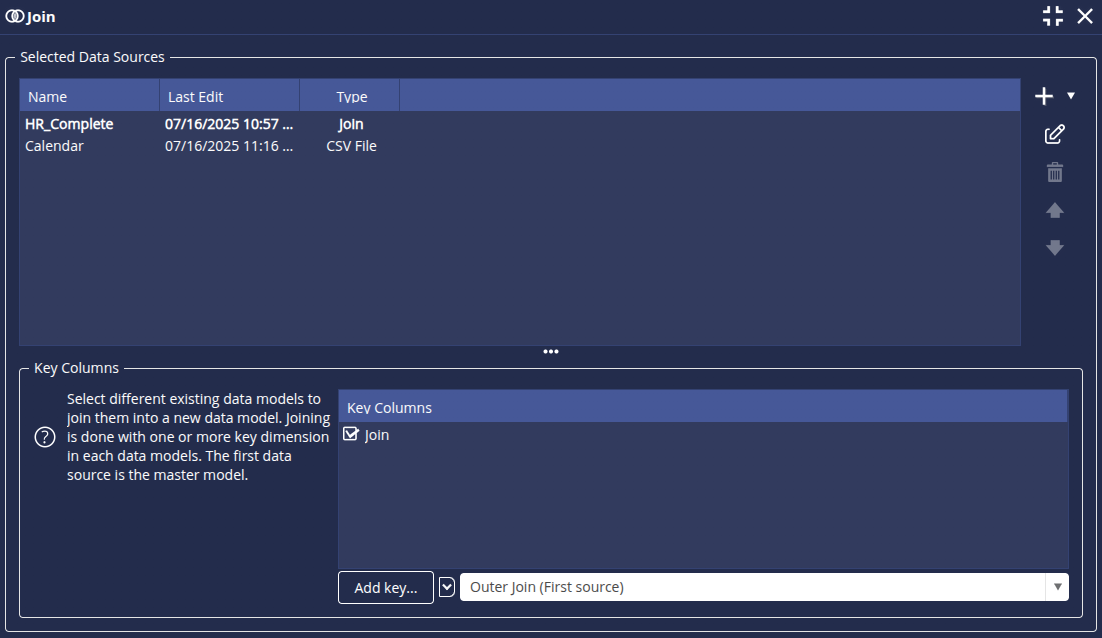
- In the Create a new data model box, select Join in the Other section.
➡ The Join dialog box appears. - Click the + button to the right of the Selected Data Sources section and select the data model Employee_Register.
- Repeat the operation to select the HR_Contracts data model.
- In the Key columns section, check the Employee ID column to use it as the join key.
- You can click Next to view the list of columns after the join.
- Click Finish and enter a name for the data model: HR_Complete.
Data model Calendar
We are now going to create the data model "Calendar" based on the file "Calendar_2020_2025_en.csv".
To do this:
- Create a new model in the same way as before and add the file "Calendar_2020_2025_en.csv" to the document server.
➡ The Excel File box is displayed with the data preview. - In the Data selection section, select the First line as header checkbox.

- Click Finish and enter a name for the data model: Calendar.
Application of the "Cartesian product" method
In order to create a Cartesian product between our two data models, "Calendar" and "HR_Complete", we need to have a common column with identical values in both models. To do this, we're going to modify the two models we created earlier and add a column that will be used as join key.
Step 2: Perform a join of the data models Calendar and HR_Complete data models
Here we are going to combine the data from the models "Calendar" and "HR_Complete" models. To do this, we first need to modify the models so that we have a join key.
Modifying the model Calendar
- Edit the data model "Calendar".
- Add an empty column.
- Open the Data Transform... tab.
- Click Add to create a new data transformation.
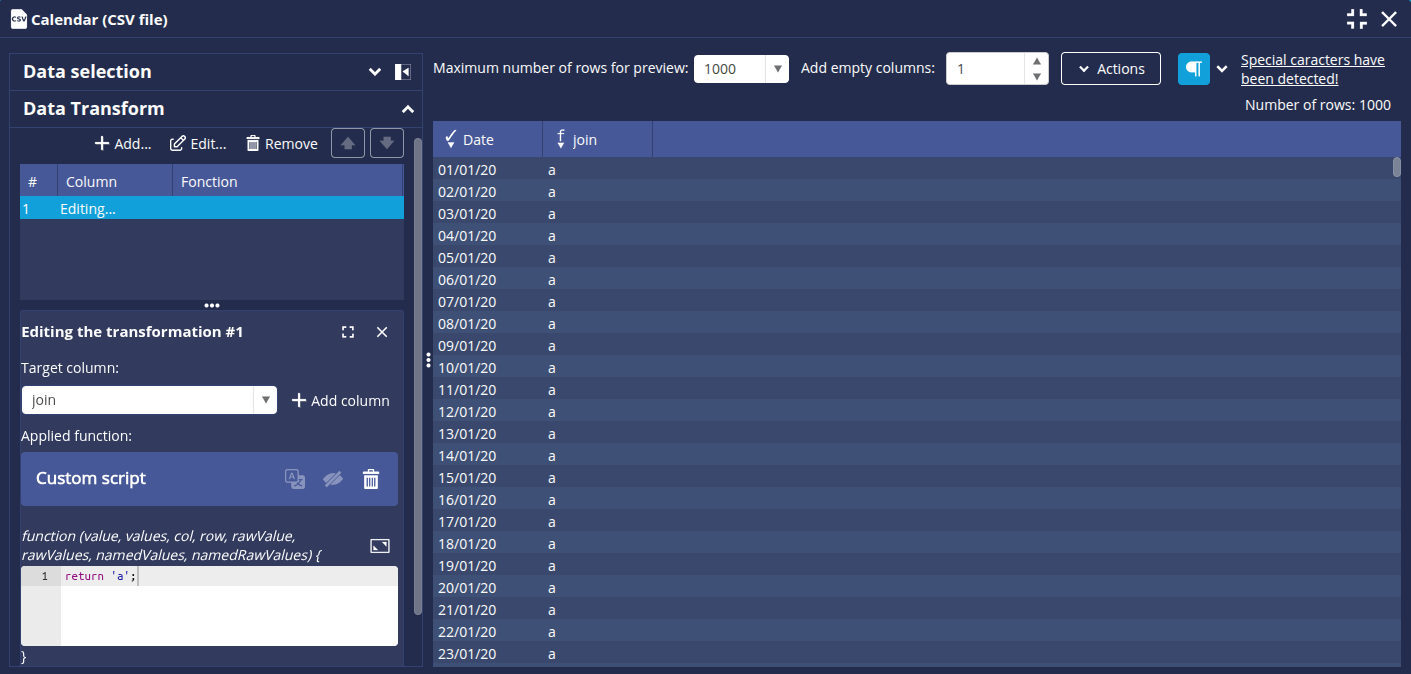
➡ The interface Creating the transformation is displayed. - Select Column1 from the Target column drop-down list.
- Enter the following code in the script editor:
return 'a'; - Click Apply and then the button to finish.
- Click the column header then Rename to give the column the name Join.
- Click Finish to save.
Modify the model HR_Complete
We are going to modify the model HR_Complete model via the model HR_Contracts model.
- Edit the data model HR_Contracts.
- Add a second column.
- Carry out the same operations as in the previous section to get the Join column.
- Click Finish to save.
➡ A message warns you that the dependent models have been updated.
- Click OK.
➡ In this way, the column is moved up to the model "HR_Complete":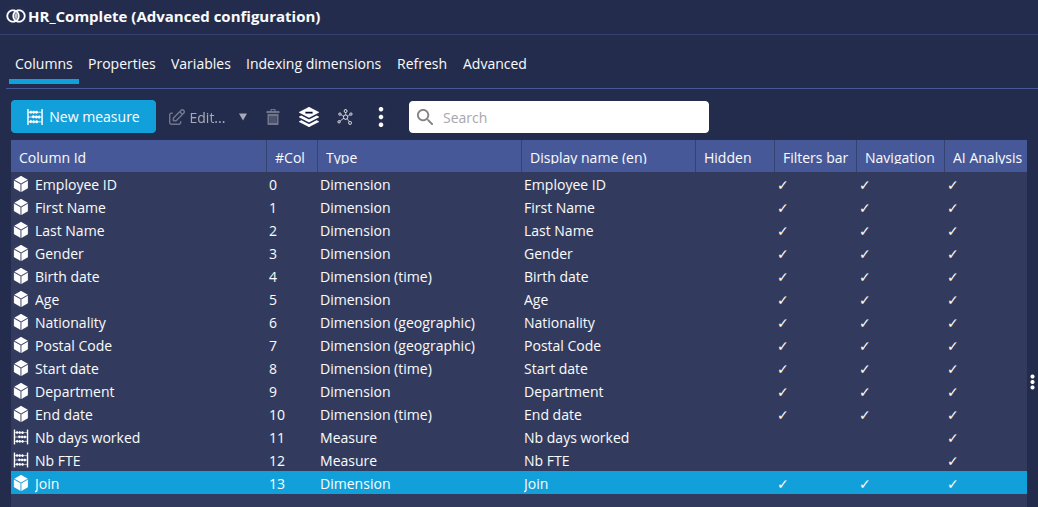
Join the data models HR_Complete and Calendar
We are now going to combine the data models HR_Complete and Calendar by performing a join.
- Create a new Join data model as described in the paragraph Data model HR_Complete.
- Add the model HR_Complete model and then the model Calendar.
- Check the Join column in the Key columns section.
Step 3: Calculate the sum of FTEs
To continue, on the next screen we are going to create a calculated measure giving the sum of the FTEs:
- Click Next to display the list of columns.
- Click the New measure button and then Calculated measure (advanced user).

- Enter the following code:
&& (new Date(<End date>*1000) >= new Date(<Date>*1000)
|| <End date>=='null'))
{
return <Nb ETP>;
}
return 0;
- Enter the name of the measurement: Sum FTE.
- Uncheck the Compute after aggregation box.
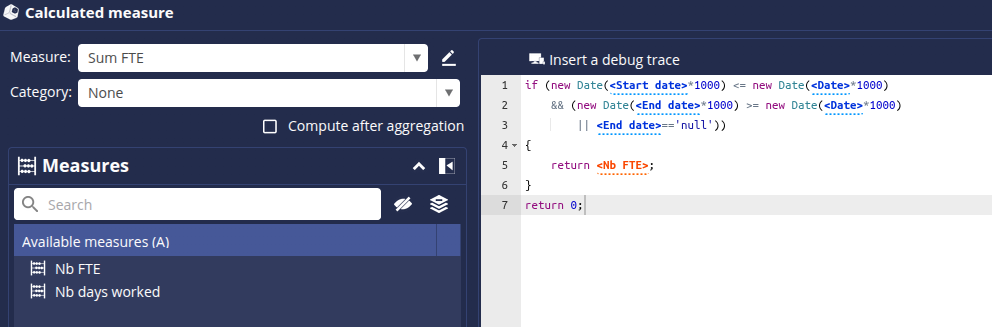
- Click OK.
➡ The measure is added to the list of columns. - Click Finish and name the model FTE Cartesian product.
Step 4: Create a table FTEs by department
We can now create a table displaying the sum of FTEs by department to visualize the result.
- From the Flows tab, click the New flow button.
- In the Create a flow such as as chart or a document builder box, select Table.
- Select the data model FTE Cartesian product FTE.
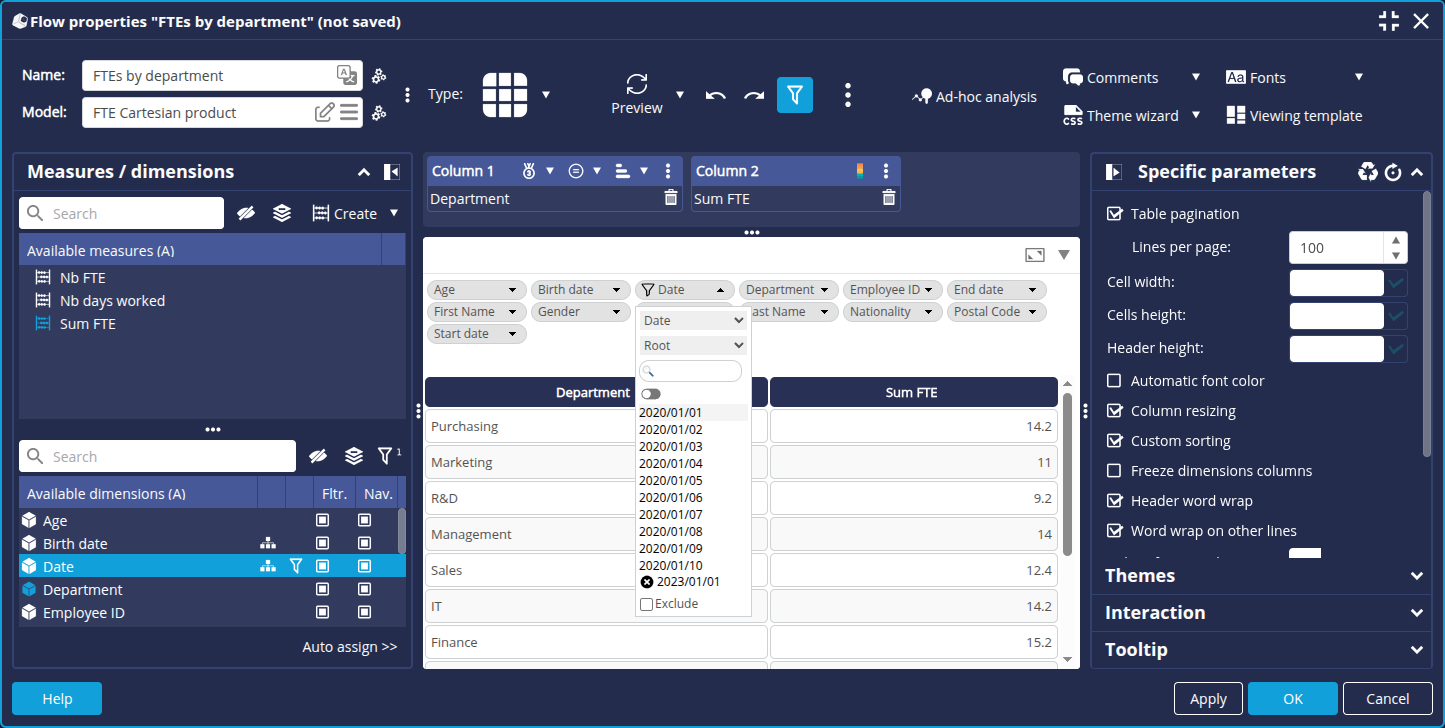
- Drag and drop the dimension Department and then the measure Sum FTE.
- Filtering on the date 01/01/2023, you should obtain the following table:
Application of the "data model "HR_Complete" alone" method
For this second method, we are going to work on the FTEs gained, lost and stable over the current year. In this example, we will obtain the results at today's date.
To do this, we need to determine three values: the FTEs for year N, year N-1 and the total of the two. These data will enable us to find out the number of FTEs for the current year, as well as any variations (new employees and leavers). We are therefore going to create 3 new measures calculated in the data model "HR_Complete".
Step 2: Create the measures FTE N, FTE N-1 and FTE N & N-1
- Edit the data model HR_Complete.
- Click Next to go to the Columns tab.
- Create a new calculated measure (advanced user).
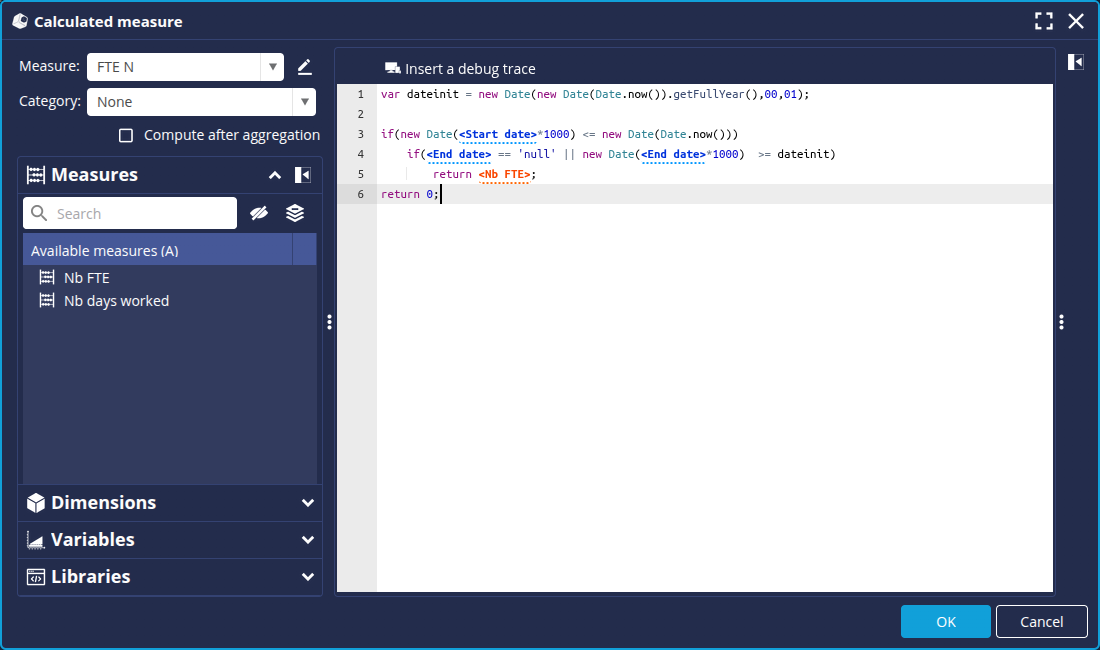
Measure ETP N
To calculate the FTEs for year N :
- Enter the following code:
if(new Date(<Start date>*1000) <= new Date(Date.now()))
if(<End date> == 'null' || new Date(<End date>*1000) >= dateinit)
return <Nb FTE>;
return 0;
- Enter the name of the measure: FTE N.
- Uncheck the box Compute after aggregation.
- Click OK.
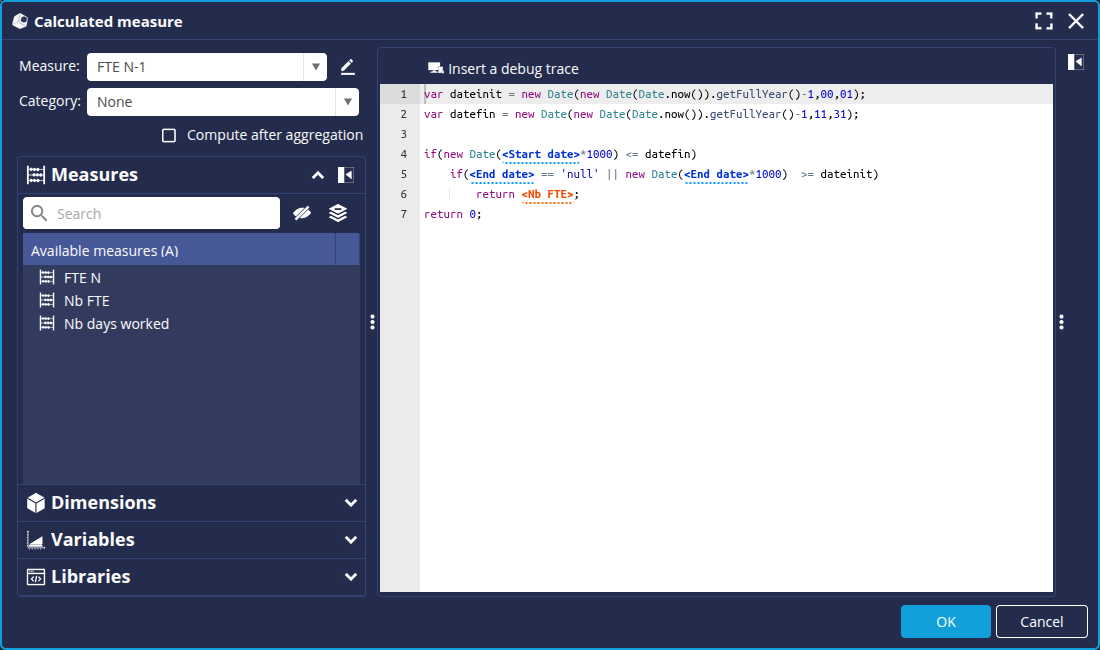
Measure FTE N-1
To calculate the FTEs for year N-1:
- Enter the following code:
var datefin = new Date(new Date(Date.now()).getFullYear()-1,11,31);
if(new Date(<Start date>*1000) <= datefin)
if(<End date> == 'null' || new Date(<End date>*1000) >= dateinit)
return <Nb FTE>;
return 0;
- Enter the name of the measure: FTE N-1.
- Uncheck the box Compute after aggregation.
- Click OK.
Measure FTE N & N-1
To calculate the total FTE for year N and N-1 :
- Enter the following code:
var datefin = new Date(new Date(Date.now()).getFullYear(),11,31);
if(new Date(<Start date>*1000) <= datefin)
if(<End date> == 'null' || new Date(<End date>*1000) >= dateinit)
return <Nb FTE>;
return 0;
- Enter the name of the measure: FTE N & N-1.
- Uncheck the box Compute after aggregation.

- Click OK.
- Click Finish to save the changes.
Step 3: Create measures gained, lost and stable FTE
From here, all that remains to do is to calculate the differences between these values to obtain the desired measures:
- Gained FTE represents new entrants in the current year
- Lost FTE represents those leaving between the previous year and the current year
- Stable FTE represents the others who have not moved
To do this, we will create 3 new measures calculated in the same way as above, with the following properties.
Measure Gained FTE
Enter the following code:
- Enter the name of the measure: Gained FTE.
- Leave the Compute after aggregation box checked.
- Click OK.
Measure Lost FTE
Enter the following code:
- Enter the name of the measure: Lost FTE.
- Leave the box Compute after aggregation checked.
- Click OK.
Measure Stable FTE
Enter the following code:
- Enter the name of the measure: Stable FTE.
- Leave the Compute after aggregation box checked.
- Click OK.
You should obtain the following columns:
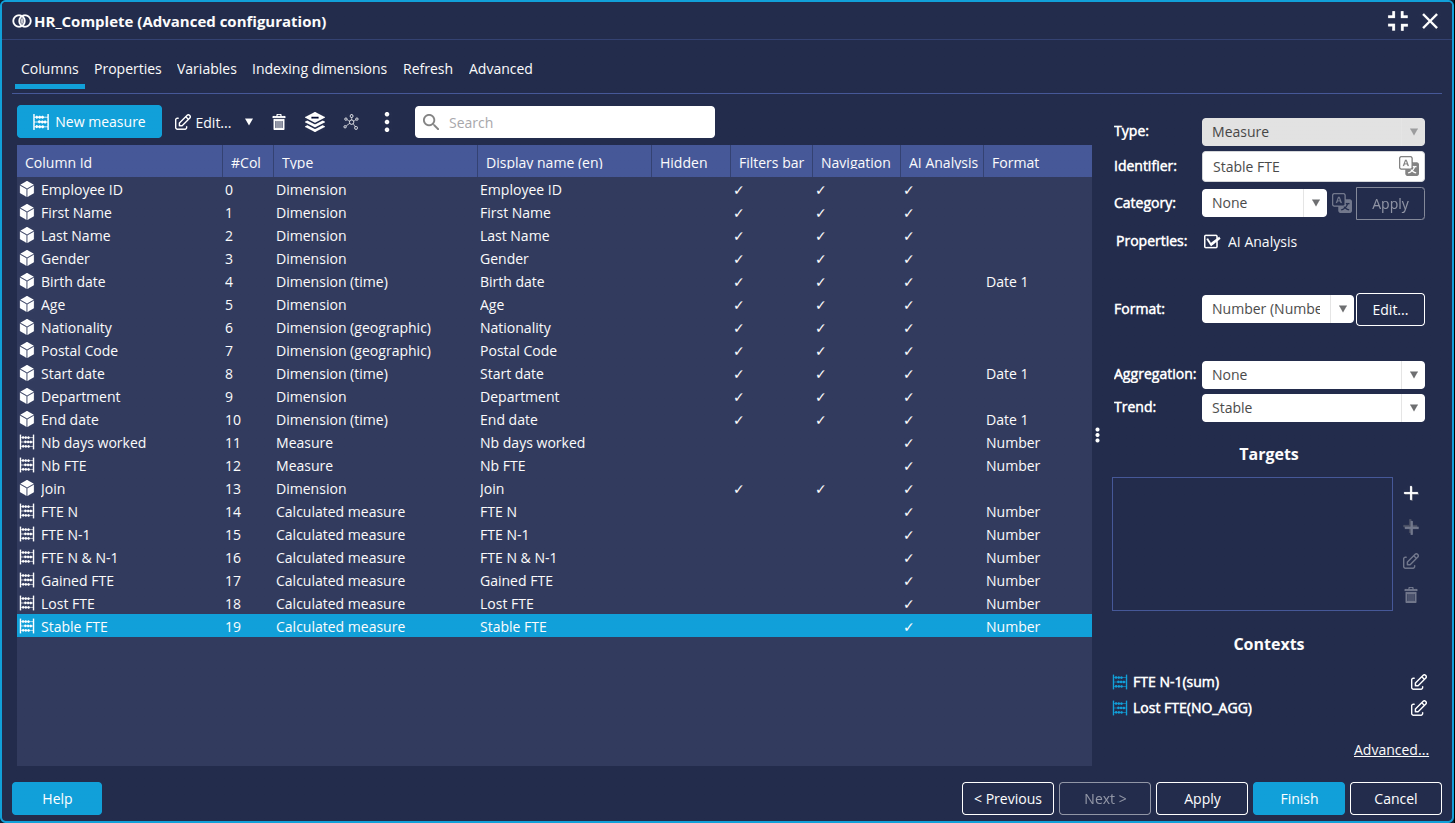
Click Finish to save.
Step 4: Check the result
To check the result, we are going to create a table showing the gained, lost and stable FTEs by department.
- From the Flows tab, click on the New flow button and then select Table.
- Select the data model HR_Complete.
- Drag and drop the dimension Department and then the 3 measures Gained FTE, Lost FTE and Stable FTE.
➡ You should obtain the following result. We can see that during this year, we have lost no employees and there have been no new hires. This is normal given the dates in our dataset.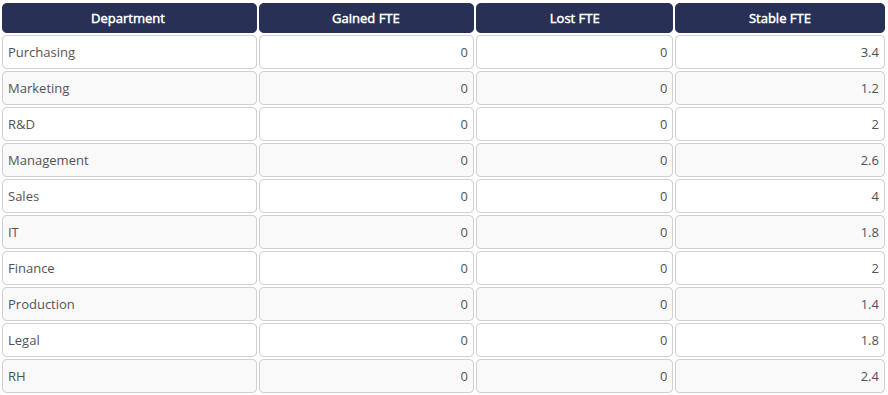
If we were in 2024, we would obtain the following result : no new employees but some left.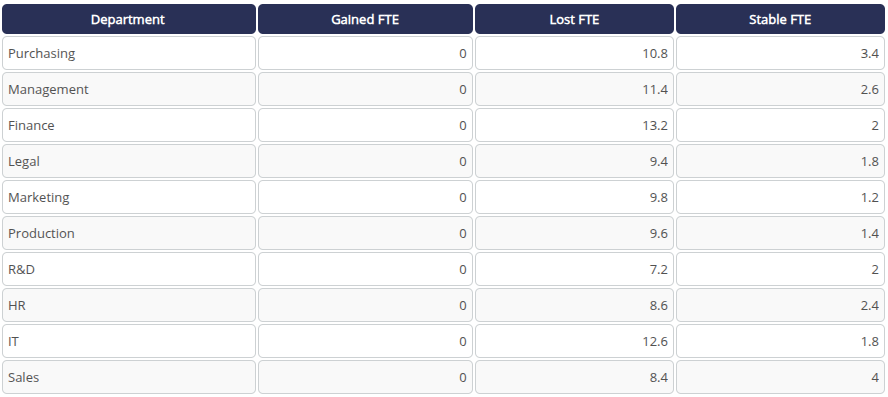
- Rename the Flow and click OK to save.
Congratulations!
You have successfully created an FTE tracker.
Now all you have to do is apply it to your data!